



%20(93).png)


.svg)



Five comp processes are ready to automate in 2026 and beyond: merit matrix design, merit budget modeling, pay equity analysis, market benchmarking and job matching, and leadership reporting.
Automate the groundwork: calculations, analyses, scenarios and reports. Keep the decisions, approvals and employee conversations with your team.
CompportIQ, Compport's compensation intelligence layer, handles that groundwork on your live comp data with numbers computed by tested engines.
Nothing changes anyone's pay without a named person approving it.
Compensation is getting harder to run by hand. Mercer's 2026 planning research describes leading organizations moving away from across-the-board increases toward targeted, data-driven merit strategies, with a projected national average merit increase of 3.2%. Targeted pay means that every cycle requires more modeling, more analysis, and more checks before a single number reaches a manager.
The analysis expected around each cycle keeps growing, too. Mercer reports that 68% of employers now conduct pay equity analyses regularly, and the EU Pay Transparency Directive's first reporting obligations begin in 2027.
If your merit grids get rebuilt in spreadsheets, your pay equity study runs through a consultant or a separate tool, and every analytics question waits in an analyst's queue, each cycle means exporting sensitive data, re-running numbers, and reconciling versions. The answer often arrives after the decision it was meant to inform.
Automating that work is only half the answer. In compensation, automation must also be trustworthy. The numbers need to come from tested calculation engines, the analysis has to run where pay decisions actually happen, and a person has to approve anything that touches pay.
CompportIQ, Compport's compensation intelligence layer, is built to that standard. It's the lens for the five processes below: merit matrix design, merit budget modeling, pay equity analysis, market benchmarking and job matching, and leadership reporting.
Below, we walk through each process: what it involves when done by hand, what automation changes, and what should stay with your team.
What should (and shouldn't) be automated in compensation
A simple test helps here. If the work is a calculation, an analysis, a scenario, or a report, it can be automated. If it's a judgment call, an exception, an approval, or a conversation with an employee, it stays with people.
That split matters because comp decisions affect individual pay. Automation should prepare the decision, show its reasoning, and hand it to the right person. Recommendations should land inside your existing workflow, where a manager proposes, and an approver decides, so no one's pay changes because software said so.
5 compensation processes at a glance
1. Designing a merit matrix
A merit matrix sets the increase percentage for each combination of performance rating and compa-ratio range. Designing one by hand means building the grid in a spreadsheet, checking that it meets the target average, and rebuilding it whenever someone asks for more differentiation or a different spread.
With CompportIQ, you describe what you want in plain English.
For example: "a grid differentiated by rating and compa-ratio, averaging 8%, with ±2% of differentiation." CompportIQ routes the request to the right purpose-built agent and returns a proposed grid centered on your target, with the spread across ratings and compa-ratio bands laid out in a table you can export.
From there, the grid is yours to edit. Click any cell to change the increase percentage and the matrix updates.
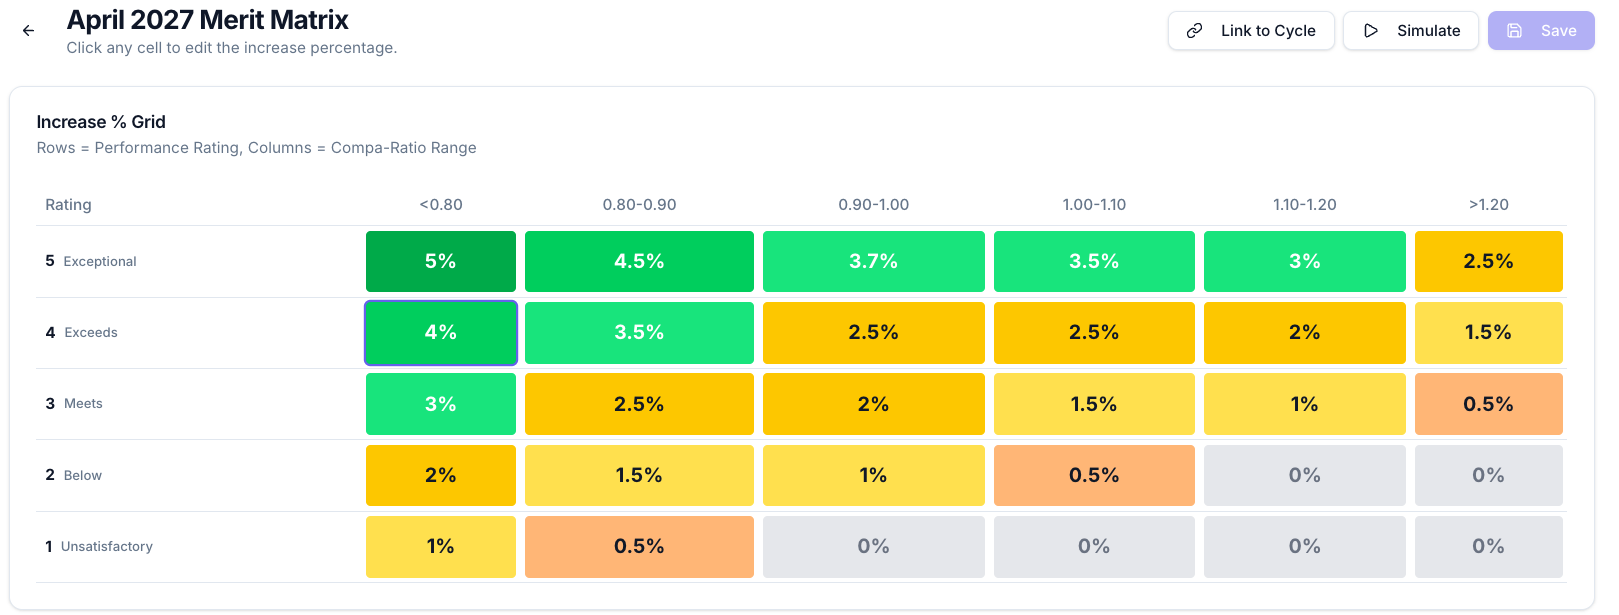
What stays with you: the grid only moves into a live cycle when you choose to link and save it.
2. Modeling merit budget
Every version of a merit grid has a cost, and working it out by hand means re-running the numbers across the whole population for each change. That's slow, and it limits how many scenarios you can realistically compare before the cycle opens.
CompportIQ shows the cost of the grid as you build it. Each cell shows how many employees it covers, and the totals show current cost, projected cost, and the cost impact of the grid you're looking at. Below that, an employee-level view shows where each person lands, their current pay, their increase, and the projected result.
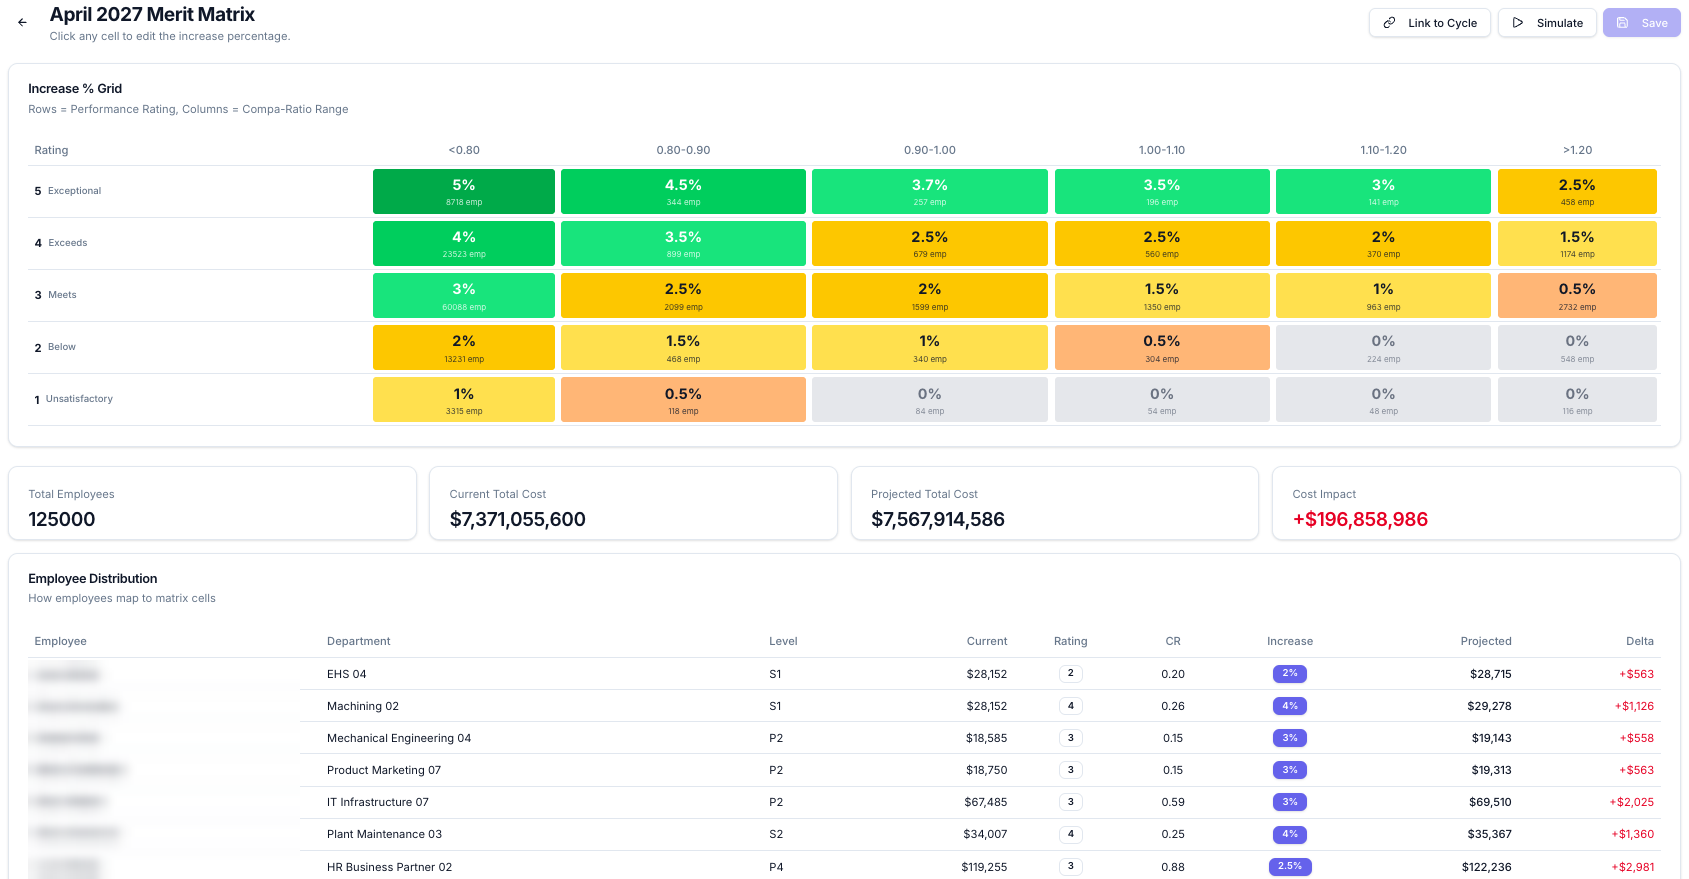
Every figure here is computed by tested calculation engines on your data. The same inputs always give the same result, which is what lets finance trust the number you bring them.
What stays with you: you run the simulation, compare scenarios and decide which version goes forward.
3. Pay equity analysis
Whether run manually or through a separate tool, every pay equity analysis involves exporting data, running the statistics outside the system where pay decisions happen, and re-importing what you learn.
CompportIQ runs pay equity analysis on your live data, inside the platform that runs the cycle. It uses standard, documented statistical methods with declared control factors, so an outside expert can review and reproduce the result. The output shows the adjusted gap and whether it's statistically significant, which cohorts are affected, and how many employees are at risk.
.png)
Two details are worth pointing out.
First, the analysis runs a reasonableness check: when a cohort's pay gap looks implausibly large, it's flagged as a likely data issue or uncontrolled factor to review, instead of being reported as a finding. Second, you can drill into what's driving a gap and export the analysis for auditors.
What stays with you: deciding what the findings mean for your organization, and approving any remediation.
4. Market benchmarking and job matching
Compensation benchmarking starts with matching your roles to survey jobs, and that's where much of the manual effort goes. Titles are unreliable. The same title can mean different scope and level in different organizations, and matching on title alone skews every percentile that follows.
CompportIQ benchmarks against the market data you license and load.
Ask for a benchmark in plain English, like "benchmark my plant manager position in the US," and you get base salary and total cash across percentiles, with a chart and a table you can export.
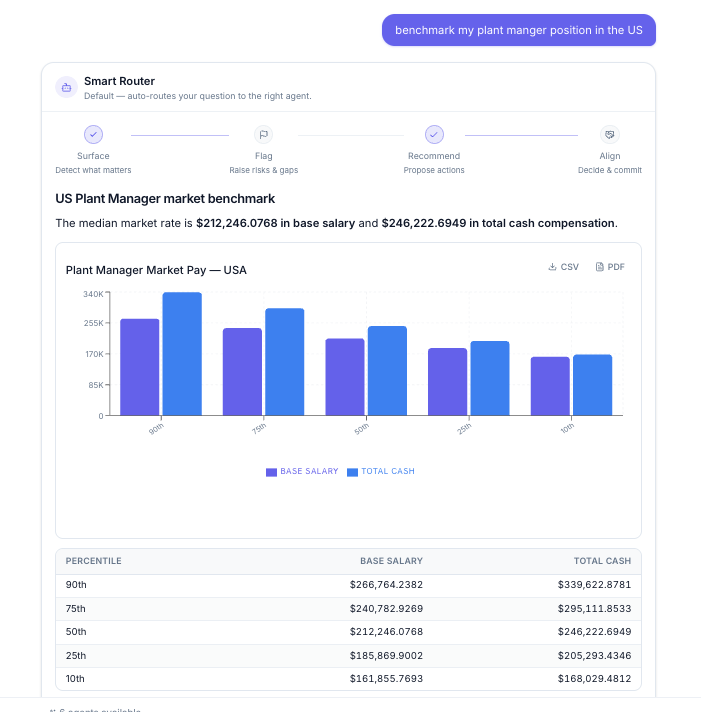
For matching, CompportIQ looks at job scope and organizational level, not title alone. Each benchmark match gets a score, and matches are marked as confident or as needing review, so your team spends its time on the edge cases rather than on every role.
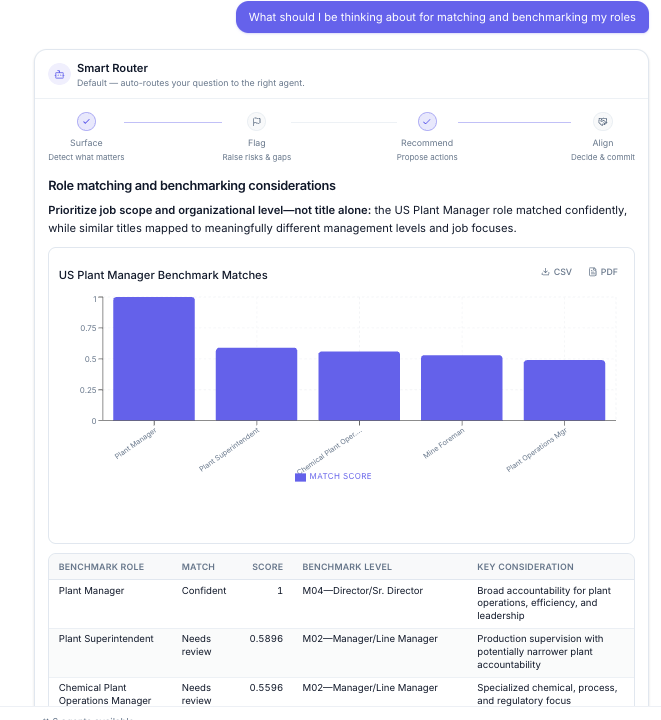
What stays with you: reviewing flagged matches and deciding how to position pay against the market.
5. Leadership and board reporting
Every leadership meeting needs a comp update, and every update means pulling numbers, building charts, and writing the story around them. When each analytics question queues behind an analyst, the report often arrives after the decision it was meant to inform.
With CompportIQ, you ask for the analysis in plain English. Ask for a board summary of your current compensation pain points, and you get the headline message, then a finding-by-finding view across market positioning, pay equity, cost base and pay for performance, with the risk next to each one.
.png)
One detail in this example is worth noticing. On pay-for-performance, the output doesn't jump to a conclusion. It notes that level-controlled analysis is needed before concluding that performance and pay are misaligned. Knowing when a finding isn't settled yet is what makes a report safe to put in front of a board.
What stays with you: the narrative you take into the room, and the decisions that follow.
How to pick which process to automate first
Start with the process where your team spends the most repeated effort and where a manual error costs the most. That might be merit matrix and budget modeling ahead of a salary review, or pay equity analysis ahead of a reporting deadline.
Pick something with a clear before-and-after measure, like the time it takes to prepare a cycle or to turn around an analysis. Run it through one cycle, measure the result, then expand to the next process.
Automate the groundwork, keep the decisions
Each of the five processes above follows the same pattern. CompportIQ (intelligence layer of Compport) works on your live data to surface what matters, flag risks and gaps, and recommend actions. Your team reviews, adjusts, and decides.
Every number is computed by tested engines; agents only see what the person asking is allowed to see, every action is logged, and no output changes a record without a named person approving it. The groundwork gets faster. The decisions stay yours.

FAQs
Which compensation processes can be automated?
Processes built on calculation, analysis, and reporting are the best candidates: merit matrix design, merit budget modeling, pay equity analysis, market benchmarking and job matching, and leadership reporting. Approvals, exceptions, and employee conversations should stay with the people involved.
Can AI automate merit increase planning?
An AI compensation software can draft a merit matrix from your targets, model the cost of each version, and show where every employee lands. The final grid and any changes to someone's pay should still be approved by a person.
How do you automate pay equity analysis?
Run the analysis on live compensation data using standard statistical methods with declared control factors, so results are reproducible. Good tools also show which cohorts are affected, flag implausible results as possible data issues, and let you export the analysis for auditors.
Will automating compensation remove human judgment?
No. Automation handles calculations, analyses, and reporting, while recommendations flow into your existing approval workflow. People still decide, approve, and explain every pay change.
What is the first compensation process to automate?
Start where repeated effort and error risk are highest, such as merit matrix and budget modeling before a salary review, or pay equity analysis before a reporting deadline. Measure one cycle, then expand.
%20(92).png)
%20(91).png)