

%20(40).avif)


.svg)


In global enterprises with 10,000+ employees, compensation data sits across payroll systems, HRIS platforms, and spreadsheets.
When leadership asks, "Are we paying fairly?" or "Can we afford these raises?", HR teams scramble to pull answers from these disconnected sources.
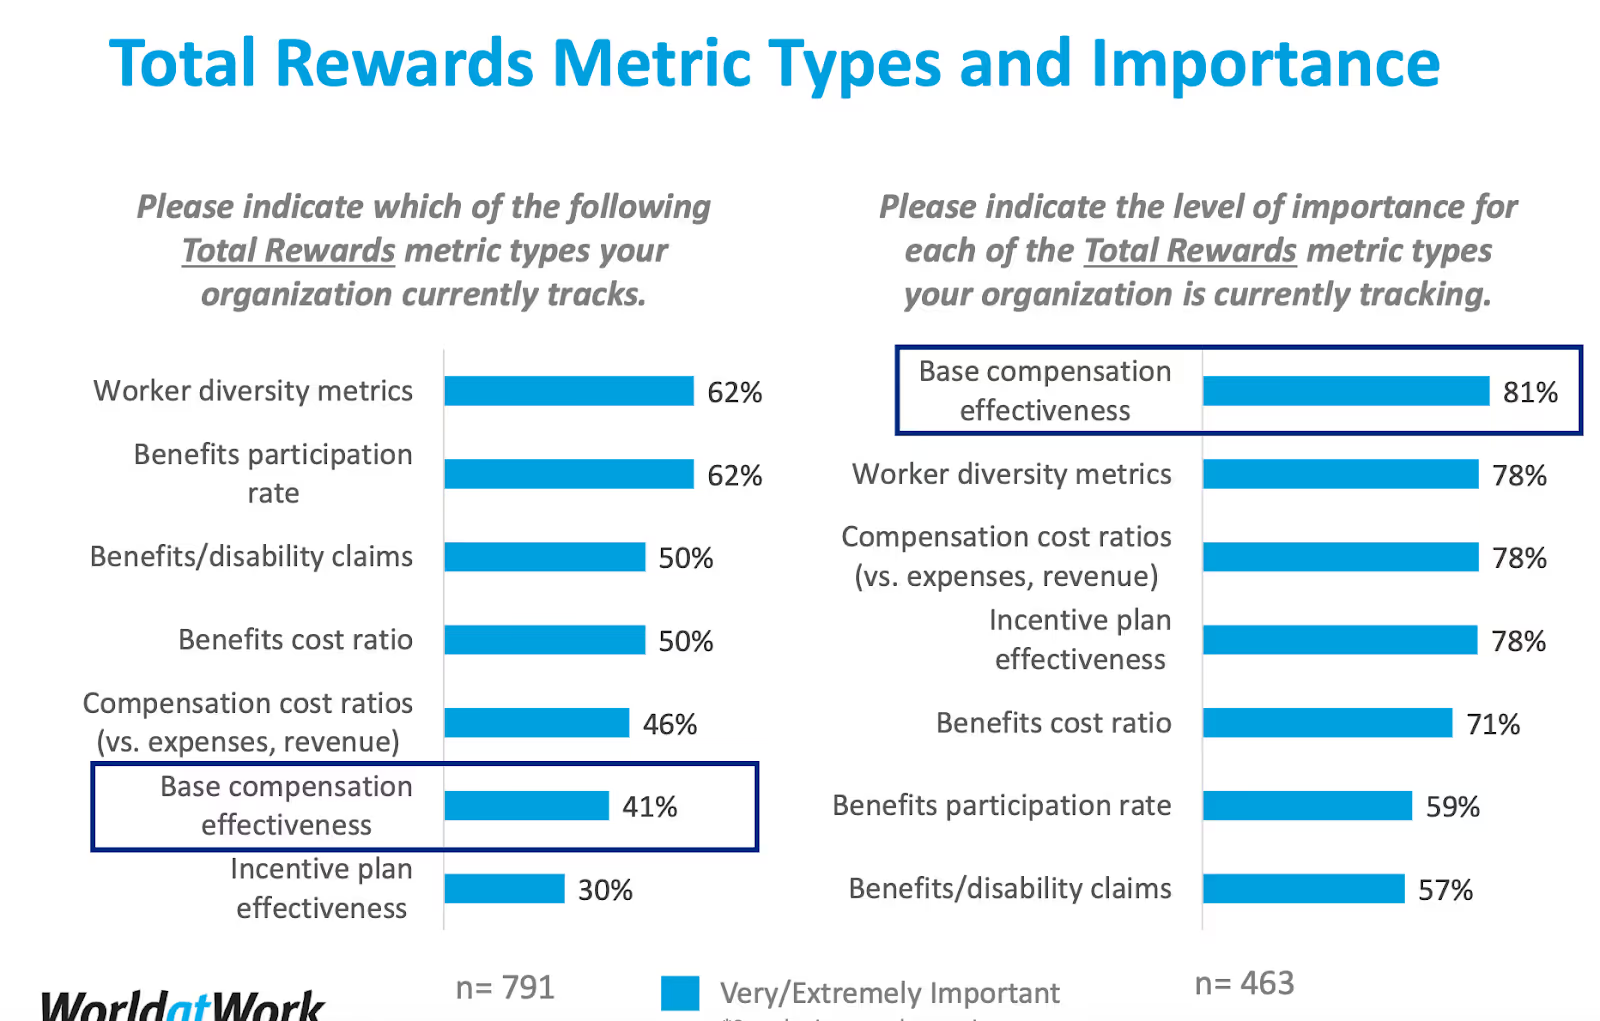
According to a WorldatWork study of 993 HR professionals, only 41% currently track base compensation effectiveness metrics, despite 81% rating it as very or extremely important.
This gap between importance and adoption reveals why compensation analytics dashboards have become critical infrastructure. They consolidate fragmented pay data into a single location where Rewards and Finance leaders can make real-time decisions on budget allocation, equity adjustments, and retention strategies.
This article examines which metrics matter most and how leading companies use them to drive fair, data-backed decisions.
The Strategy Behind Modern Compensation Dashboards
Compensation dashboards are built on four strategic pillars that work together to ensure organizations pay people correctly and sustainably.
Fairness: Pay equity and transparency
Dashboards track demographic pay gaps across gender, ethnicity, and other protected categories.
According to the same study, 62% of organizations now monitor worker diversity metrics, with 78% rating them as very or extremely important. These tools identify disparities before they escalate into legal issues or damage the employer's reputation.
Competitiveness: Market benchmarking
Only 41% of organizations currently track base compensation effectiveness, yet 81% consider it critical. Dashboards compare internal salaries against external market rates using compa-ratios and percentile rankings. This prevents talent loss to competitors offering higher pay and flags overpayment that erodes margins.
Performance alignment: Incentive effectiveness
Just 30% track the effectiveness of the incentive plan, despite its importance. Dashboards reveal whether bonuses correlate with performance ratings and whether variable pay programs drive intended behaviors.
Cost governance: Balancing pay with budgets
Only 46% monitor compensation cost ratios versus revenue or expenses, creating blind spots in financial planning. Dashboards connect pay decisions to business performance, ensuring competitive compensation remains sustainable within budget constraints and margin targets.
Core Compensation Metrics Every Global Dashboard Should Track
Modern dashboards organize metrics around business outcomes rather than data types. Here's how leading enterprises structure their compensation analytics.
At a glance
Segment 1: Competitiveness metrics: Market alignment
These metrics ensure the organization can attract and retain talent without overpaying.
Compa-ratio and market position
What it measures: Compa ratio measures how current salaries compare to external market rates. The calculation divides an employee's salary by the median or midpoint of the market range for similar roles.
Why it matters:
- Tracking market position ensures pay remains competitive enough to attract and retain talent.
- It also flags if pay is too low (risking turnover) or too high (harming cost efficiency).
- Monitoring compa-ratio across different segments by job, tenure, and gender identifies pockets of underpayment that could drive attrition or overpayment that could erode margins.
Performance ranges:
- 100% = paying at market midpoint
- Below 90% = high retention risk
- Above 110% = potential overpayment
Key KPI: Percentage of employees below 90% compa-ratio
Offer acceptance rate versus market percentile
What it measures: Where job offers land relative to market benchmarks and corresponding acceptance rates by percentile band.
Why it matters:
This reveals whether the organization is offering enough to secure top talent without later needing large adjustments.
Segment 2: Fairness metrics: Equity and consistency
These metrics reveal whether the organization pays people equitably regardless of demographics or tenure, protecting against legal risk and cultural damage.
Gender and demographic pay ratios
What it measures: Median or average pay comparisons across demographic groups, typically women versus men or by ethnicity.
Why it matters:
- Pay equity metrics reveal disparities that may indicate bias or inequitable practices. Closing these gaps is crucial for legal compliance and fostering a diverse, inclusive workplace.
- Tracking gender pay ratio helps organizations spot and address wage gaps, improving fairness and avoiding reputational or legal risks.
- From a strategic HR perspective, ensuring equitable pay boosts employee engagement and trust.
Performance ranges:
- 100% = full parity
- 95-99% = minor gap requiring monitoring
- Below 95% = significant gap requiring immediate intervention
Pay range distribution and compliance
What it measures: Percentage of employees below range minimum (green-circled), within range, and above maximum (red-circled). Also tracks salary band adherence by tenure.
Why it matters:
- These metrics ensure the integrity of the pay structure.
- A high percentage of employees below range signals outdated ranges or pay equity issues requiring immediate adjustments to prevent losing people to higher-paying competitors.
- Many red-circle cases indicate it's time to promote individuals or revise pay bands.
- Monitoring range penetration also helps detect pay compression, where new hires' salaries catch up with or exceed those of longer-tenured employees in the same band, which can hurt morale.
Performance ranges:
- Below minimum: Should be less than 5% (red flag threshold)
- Within range: Target 80-90%
- Above maximum: Should be less than 10%
Key KPIs:
- Percentage of employees below the minimum range
- Percentage of employees in each third of the range by tenure
Segment 3: Performance and productivity metrics: Pay-for-performance effectiveness
These metrics assess whether incentive programs actually reward high performers and drive desired behaviors.
Variable pay versus performance correlation
What it measures: The relationship between bonus payouts and performance ratings across the organization. Includes actual bonus payout versus target for each division and distribution of incentive pay by performance rating.
Why it matters:
- Monitoring variable pay metrics helps companies assess the effectiveness and fairness of their incentive plans.
- Seeing how bonus payouts correlate with performance ratings reveals if high performers are being adequately rewarded.
- This ensures the company is getting a good return on its incentive programs and that those programs are driving the right behaviors.
Bonus budget utilization
What it measures: Total bonus payout and merit increase budgets against plan.
Why it matters:
- Helps in budget control.
- Large firms must ensure that incentive compensation spending stays aligned with company performance.
- Tracking this allows course corrections before costs balloon.
Performance ranges:
- 95-105% = on target
- Below 95% = underspend (may indicate underperformance or overly aggressive targets)
- Above 110% = overspend requiring intervention
Segment 4: Global governance metrics: Regional consistency and compliance
These metrics ensure fair treatment across locations while maintaining market competitiveness and regulatory compliance.
Geographic pay differentials
What it measures: Comparisons of average pay for the same job across regions or countries, often using location adjustment indices or cost-of-living differentials.
Why it matters:
- Geography significantly affects pay requirements, driven by local market rates and living costs.
- Dashboards flag whether pay for "same role, same level" is aligned with local market medians in each region (US, EU, APAC, etc.), and whether regional pay policies, such as premiums for high-cost cities, are applied consistently.
- This is both a fairness issue (employees expect equitable treatment regardless of location) and a competitiveness issue (underpaying in hot markets causes talent loss, while overpaying in lower-cost areas wastes resources).
Pay transparency compliance index
What it measures: Percentage of roles with published or internally communicated salary ranges.
Why it matters:
- Essential for compliance with evolving pay transparency laws in multiple jurisdictions.
- Several U.S. states (California, New York, Colorado) now require salary ranges in job postings.
- The EU Pay Transparency Directive (effective 2026) will require companies to disclose average pay levels and gaps by categories of workers internally to employees and report significant pay gaps externally.
Segment 5: Financial metrics: Cost and ROI of compensation
These metrics connect compensation to the company's financial health and strategy.
Total cost of workforce (TCOW)
What it measures: All salaries, bonuses, benefits, and stock grants, sometimes expressed as a percentage of revenue or operating expense.
Why it matters:
- Tracking TCOW helps leadership determine whether people costs are in line with what the business can support.
- A compensation-to-revenue ratio can be benchmarked over time or against industry norms to ensure sustainability.
- This is especially important in large public enterprises where managing margins is critical—compensation must align with business performance.
Performance ranges vary by industry:
- Technology: 30-50% of revenue
- Manufacturing: 15-30% of revenue
- Professional services: 50-70% of revenue
Compensation spend versus budget
What it measures: Year-over-year compensation expense and variance from planned budget.
Why it matters:
- Year-over-year metrics on salary and benefit spend help identify if rising labor costs are outpacing growth.
- Tracking variance from the budget ensures financial discipline during reward cycles and allows mid-year corrections if needed.
Performance ranges:
- 98-102% = on target
- Below 98% = underspend (may indicate unfilled roles or lower-than-planned increases)
- Above 105% = significant overspend requiring review
How Compport Powers Compensation Analytics
Building dashboards is one thing. Making them actionable is another.
Compport's compensation analytics platform turns static data into dynamic decision intelligence for Rewards leaders managing complex global pay cycles.
Unified overview for approvals, budgets, and performance
Compport's dashboard homepage presents key operational metrics in a single view.
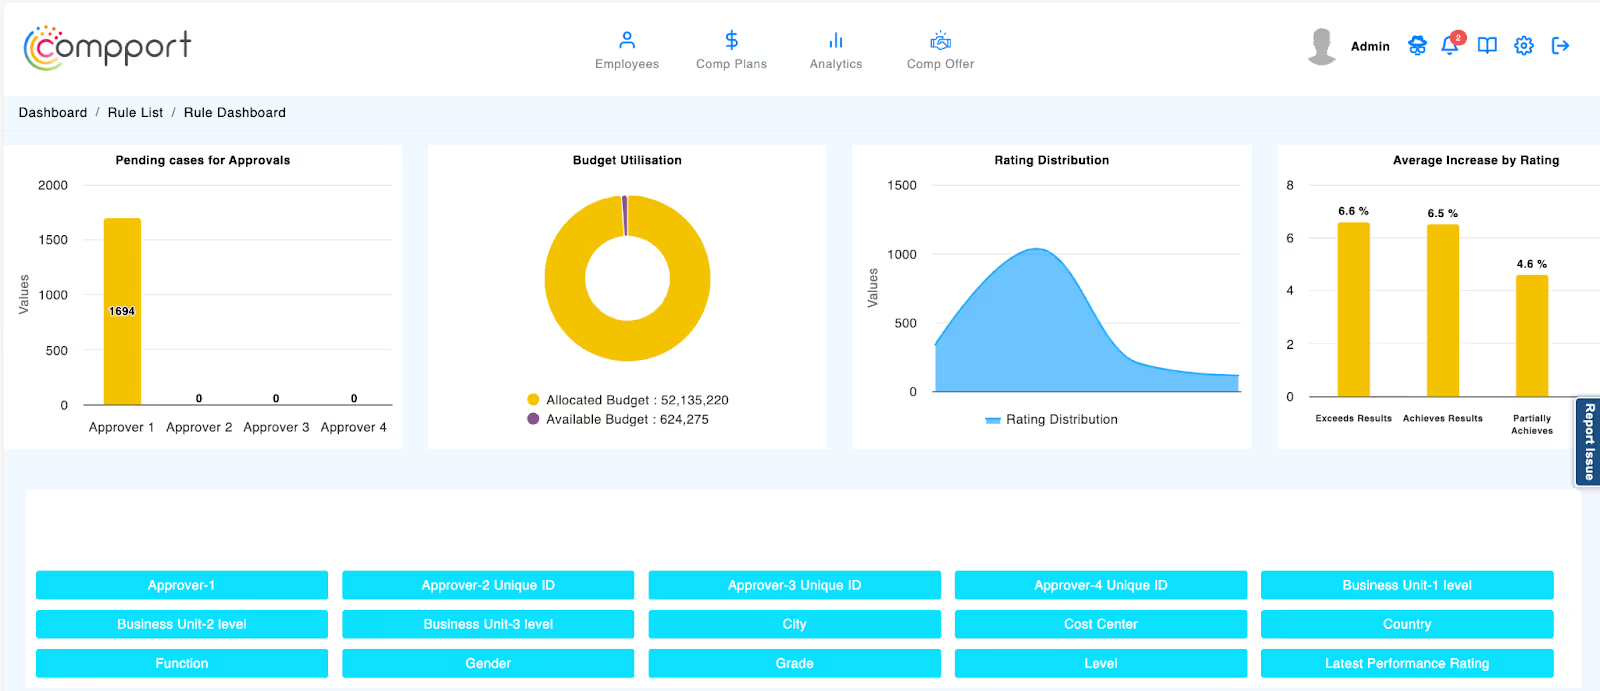
- Pending cases for approval track compensation review workflow bottlenecks by approver level, so HR knows exactly where decisions are stalled.
- Budget utilization displays allocated versus available budget in real time through visual charts, ensuring cost control before final approvals.
- Rating distribution and average increases by rating reveal pay-for-performance alignment in real time, allowing HR to validate whether high performers are rewarded consistently.
From dashboards to predictive analytics
Compport's roadmap extends beyond reporting into predictive pay analytics. Future capabilities will forecast how budget decisions, salary adjustments, or turnover risks influence future workforce costs and equity targets.
This progression from descriptive to diagnostic to predictive analytics positions Rewards teams as strategic business partners who can model scenarios before committing resources.
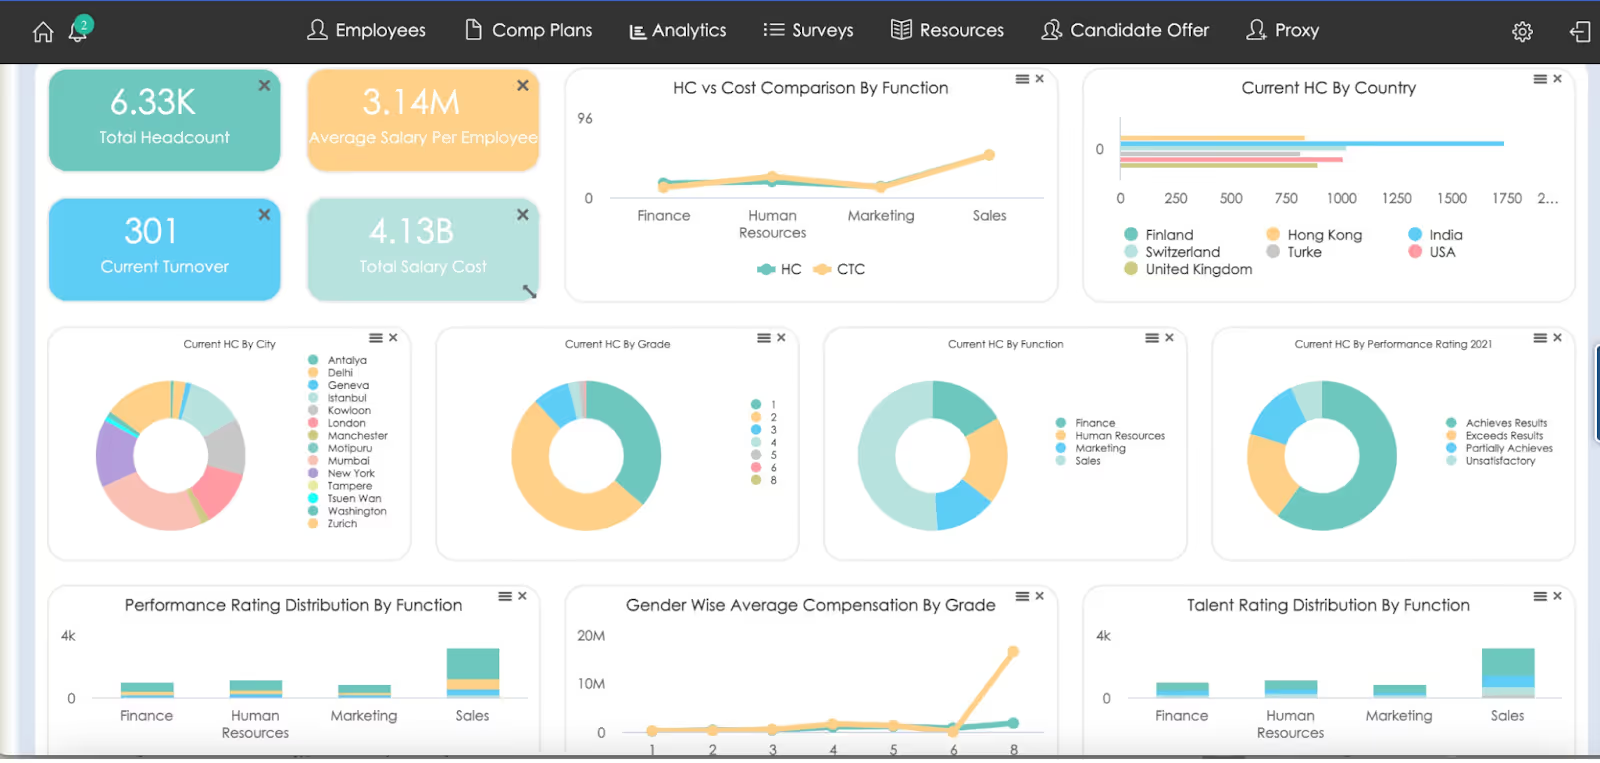
Deep-dive analytics across every HR dimension
Compport's analytics engine powers 35+ compensation, cost, and talent reports.
Organizations can analyze:
- Salary increase budget versus utilization
- Variable pay target versus payout
- Revenue and profit per FTE
- Compensation positioning pre- and post-increase
- Diversity and promotion tracking.

Each report supports 4,000+ demographic cuts by country, grade, gender, business unit, or cost center, allowing enterprises to slice data at any level of granularity.
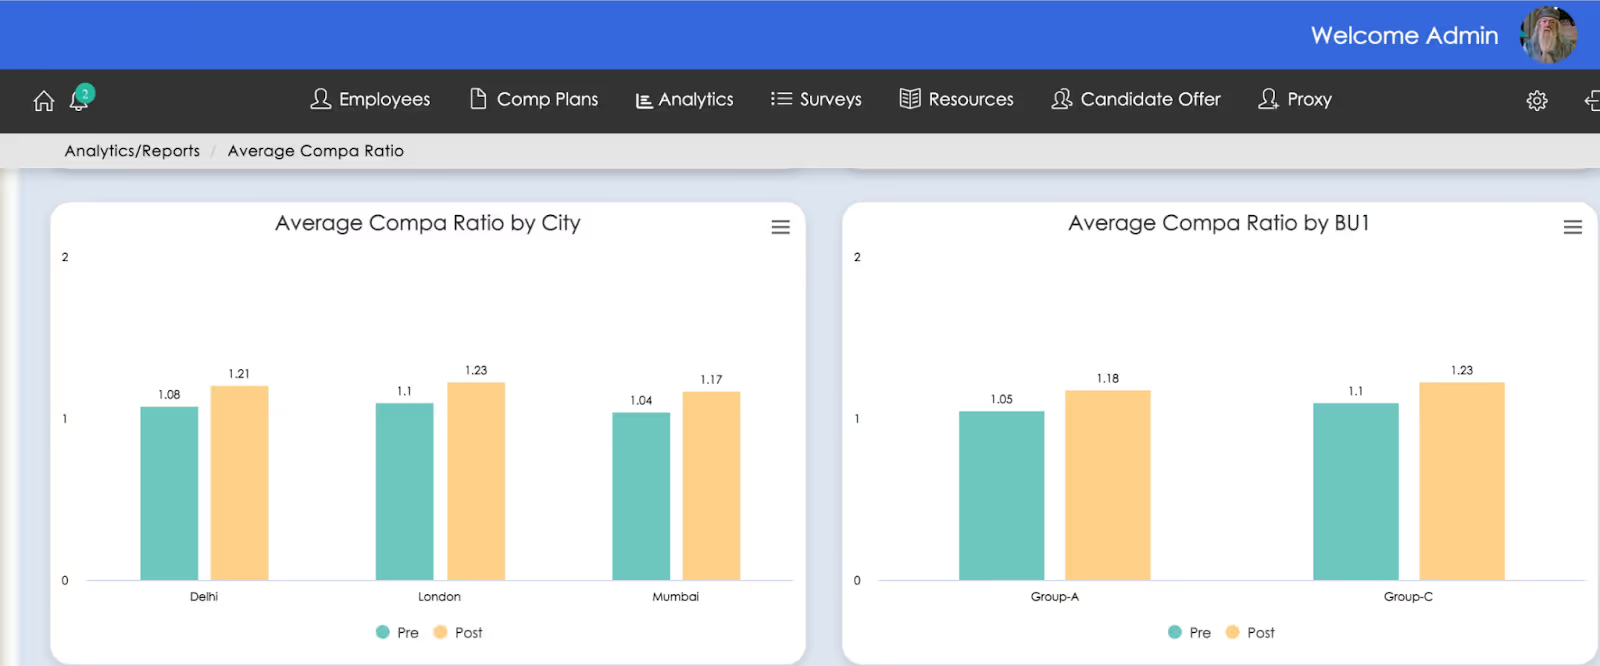
This multidimensional reporting helps organizations move from descriptive dashboards that ask "What's happening?" to diagnostic insights that answer "Why is it happening?"
For example, a Rewards leader can view compa-ratio trends by country, filter by gender, and instantly identify pay gaps or budget inefficiencies requiring intervention.
Real-world Examples from Leading Enterprises
Leading global companies demonstrate how compensation dashboards drive measurable outcomes across different regulatory environments.
Salesforce: Dashboard-driven pay equity in the United States
Salesforce has made pay equity a core business value, conducting annual compensation audits through dashboards that monitor gender and race pay gaps.
In 2024, the company reported that employees performing similar jobs were paid on par across genders globally and races in the U.S., achieving 100% equal pay for equal work. This wasn't achieved overnight.
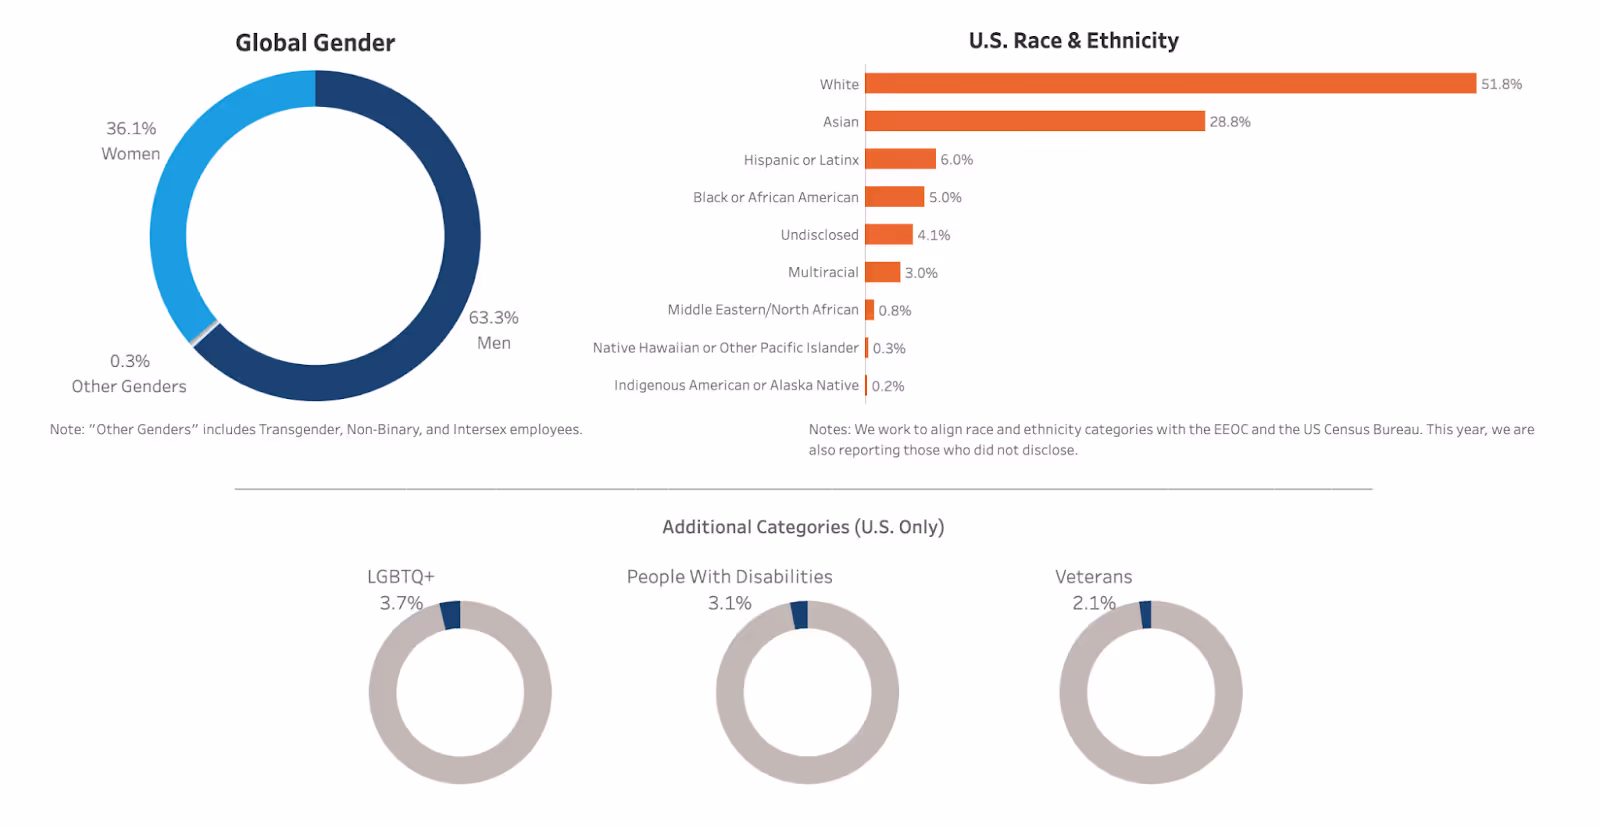
Salesforce has invested millions of dollars over several years in salary adjustments identified through dashboard analytics.
The company's Chief Equality & Engagement Officer positions equality as "our competitive edge in driving innovation, engagement, and growth."
Salesforce's dashboards serve as governance tools, turning pay equity from an HR initiative into an executive-level business priority, tracked alongside other key performance metrics.
Yara International: ESG-integrated dashboards in Europe
Norwegian-based Yara International uses compensation dashboards to monitor 17,000+ employees across multiple countries, with a focus on living wage compliance and gender pay equity.
According to Yara's 2024 integrated report, the company implements its living wage and gender pay gap policies by "monitoring the implementation of the policy through compensation dashboards and salary review outcomes."
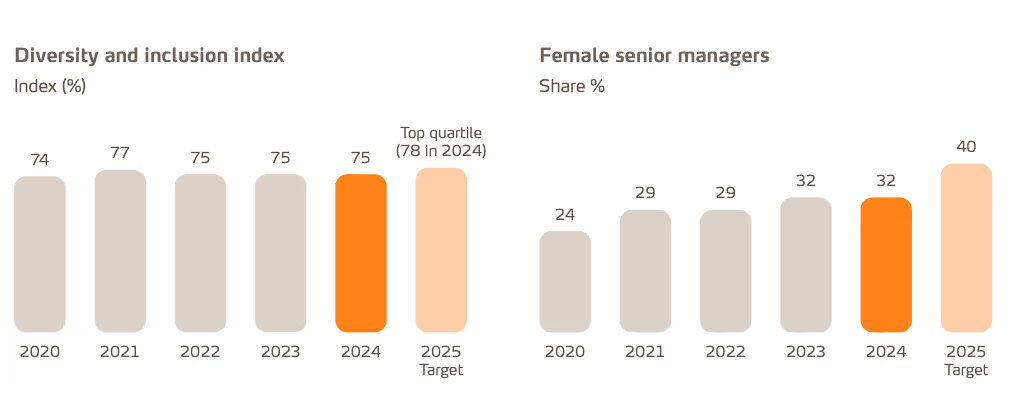
Yara's approach demonstrates how European enterprises integrate compensation analytics into broader ESG (Environmental, Social, and Governance) reporting frameworks.
The dashboard ensures every employee earns at least the defined local living wage for their market and identifies gender-based pay gaps to be corrected in annual cycles. This dual focus on absolute wage floors and relative equity positions makes Yara's dashboard both a compliance tool and a stakeholder communication asset.
Your Compensation Analytics Dashboard Needs More Than Just Vanity Metrics!
Compensation dashboards have evolved from reporting tools into strategic command centers for global enterprises.
They answer critical questions in real time:
- Are we paying fairly?
- Can we afford these raises?
- Are high performers rewarded appropriately?
Organizations that master compensation analytics don't just track metrics—they use them to close pay gaps, control costs, stay competitive, and meet evolving transparency mandates.
Ready to turn your compensation data into a single source of truth?
Large enterprises use Compport to connect market benchmarks, pay equity analytics, and performance insights into one unified dashboard. Stop scrambling across spreadsheets and disconnected systems when leadership needs answers.
See how Compport helps you design data-driven, fair, and compliant compensation strategies globally.

FAQs
What is compensation analytics?
Compensation analytics is the practice of using data to measure, analyze, and optimize how organizations pay employees. It tracks metrics like market competitiveness, pay equity, and budget utilization to drive fair, strategic compensation decisions.
What is the compensation and benefits dashboard?
A compensation and benefits dashboard is a centralized platform that visualizes pay data across metrics like salary benchmarking, bonus utilization, benefits costs, and demographic equity. It enables real-time decision-making for Rewards teams.
What's the difference between a compensation dashboard and a regular HR report?
Dashboards provide real-time, interactive analytics across multiple metrics in one view. Reports are static snapshots. Dashboards enable drilling down, filtering, and scenario simulations for actionable decisions.
How often should compensation dashboards be updated?
Real-time updates from connected systems are ideal. During active comp cycles, daily tracking is essential. Market benchmarking data should be refreshed quarterly to align with survey schedules.
Which metrics should we prioritize when building our first compensation dashboard?
Start with four pillars: compa-ratio (competitiveness), gender pay ratio (fairness), bonus budget utilization (performance), and total cost of workforce (financial governance). Expand based on needs.
%20(69).png)
%20(66).png)
%20(65).png)