

%20(53).png)


.svg)


It's Sunday night, and your payroll is done. Base salaries, overtime, shift differentials—all processed without a single question. Then Monday hits, and your inbox floods with incentive inquiries.
Payroll is predictable. Incentive cycles are not.
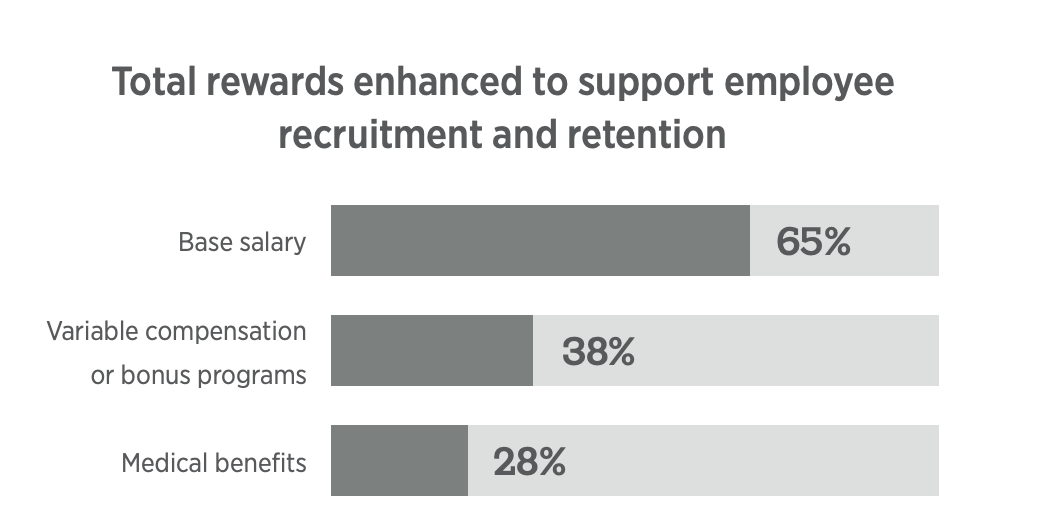
Restaurant compensation has evolved. According to Gallagher’s 2024 Hospitality & Restaurant Workforce Trends Report, 38% of restaurant employers now prioritize variable compensation and bonus programs as a core retention strategy. Performance pay isn’t optional anymore — it’s strategic.
And that’s where the friction begins.
Restaurant manager bonuses now depend on multiple performance metrics — sales, labor cost, food waste, guest satisfaction, compliance, and speed of service. Each KPI carries its own thresholds, weightings, and payout logic.
The structure is intentional. Restaurants operate on tight margins. Incentives are designed to protect profitability.
But the calculations behind them are rarely built for scale.
- When a store hits its sales target but misses labor cost by two points, which metric drives the payout?
- When a manager covers multiple locations mid-cycle, how is that split?
- When someone questions a $847 bonus, can the math be reconstructed instantly?
Variable pay may be a retention strategy. Without operational clarity, it becomes a source of doubt instead.
This article explains why restaurant incentive calculations create more operational chaos than payroll and what happens when manual processes turn performance bonuses into trust issues between managers and leadership.
Reason #1: The Multi-KPI Problem
Restaurant inventives aren't simple anymore. A typical incentive calculation tracks sales targets, labor cost percentage, food waste, guest satisfaction scores, compliance metrics, and speed of service. Each KPI has its own threshold before it starts paying out, its own cap on maximum earnings, and its own weight in the final payout.
Sales might be weighted at 30%, labor cost at 25%, food waste at 15%, guest scores at 20%, and compliance at 10%. Hit 105% of your sales target but miss your labor cost threshold by two percentage points? The entire payout recalculates.
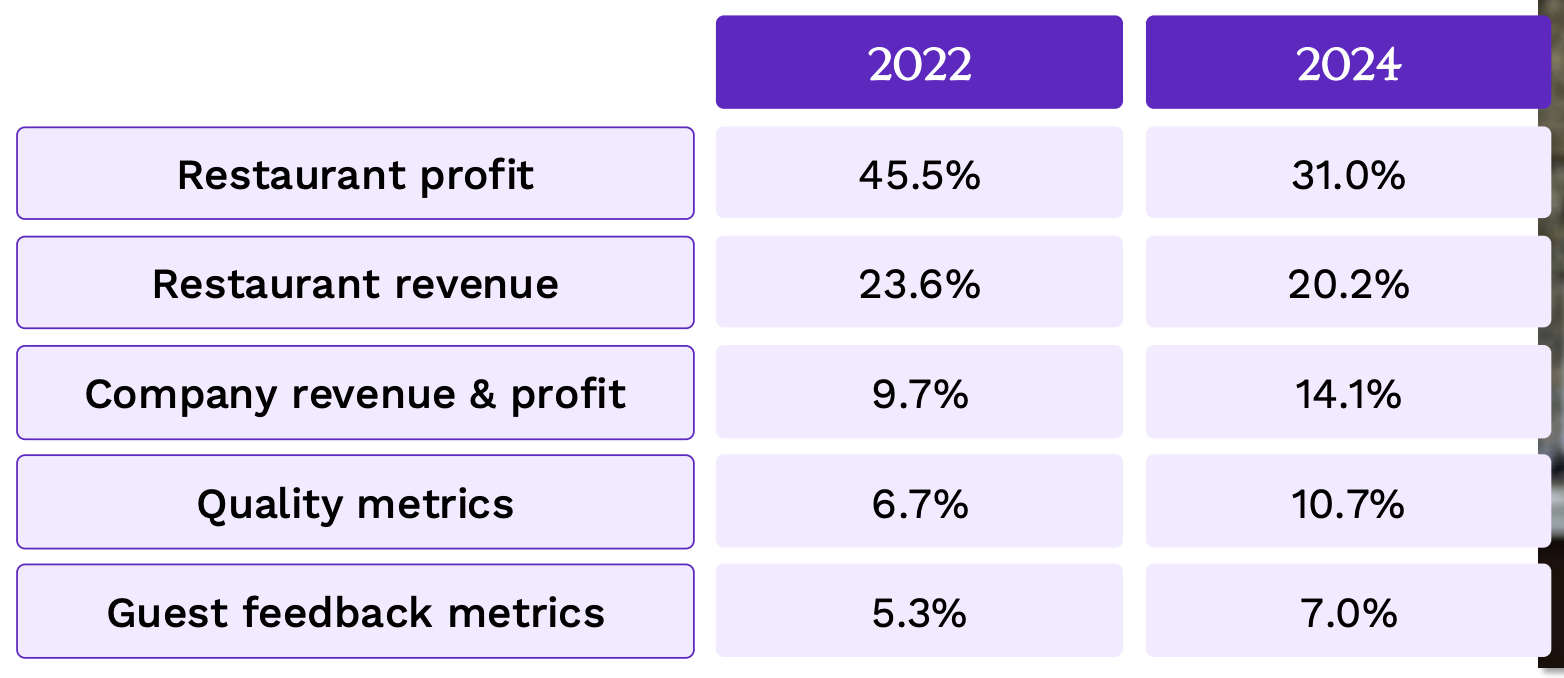
The structure is also expanding. Black Box Intelligence’s 2024 Total Rewards research shows the weight of Restaurant General Manager bonuses tied strictly to restaurant profit has declined, while quality metrics, guest feedback, and broader company performance now carry more weight. Incentive design is becoming more multi-dimensional — and more computationally intensive.
Different segments prioritize different metrics. QSRs may emphasize throughput and labor efficiency, while full-service brands weigh guest experience more heavily. That variation further fragments bonus logic across brands — making manual calculation even harder to standardize.
Reason #2 The Visibility Gap
Your employee opens their payslip and sees an incentive payout.
- No breakdown.
- No explanation of which KPIs drove it.
- No comparison to last month.
Just the final amount.
So they email HR. "Why is my bonus different this month? I thought we hit our sales target."
Now someone in finance has to reconstruct the calculation.
They pull up the spreadsheet.
Store sales were at 102% of target—that part checks out. But labor cost hit 34.5% instead of the 32% threshold, which triggered a reduction in the bonus pool. Food waste came in just under the cap. Guest satisfaction score improved from last month, adding a small bump.
Then there's the weighted formula that accounts for all six metrics, plus the mid-month adjustment because the employees covered a second location for two weeks.
Two hours later, finance sends back an explanation. The employee reads it, still confused about why labor cost mattered more than exceeding sales targets. This happens every cycle.
This happens every cycle. When managers can't see the math, they default to assuming the calculation is unfair. Research shows employees are 43% less likely to quit when they feel compensation is fair. The incentive becomes a point of friction instead of motivation.
Reason #3 Mid-Cycle Changes Break Everything
Consider any one of the following situations:
- An assistant manager covers three locations in one month because you're short-staffed. How do you split her bonus across different stores with different performance metrics?
- A General Manager takes medical leave in week six of the quarter. Do you prorate based on weeks worked or adjust the targets?
- An acting store manager fills in temporarily while you recruit a permanent replacement. Which KPIs apply—the ones for her regular role or the temporary assignment?
Manual proration for one mid-cycle change takes two hours and requires three people to verify the calculation. Someone has to determine which metrics apply, split the time period, adjust the thresholds, and then reconcile everything into a single payout that makes sense.
In restaurant operations, movement is constant. Promotions happen mid-quarter. People transfer between locations. Short-staffing means managers juggle multiple stores. Each situation needs its own proration logic.
- Which KPIs apply when someone works across multiple locations?
- How do you weigh performance when responsibilities change mid-cycle?
- What happens to targets when someone's only been in the role for half the measurement period?
Retention-based bonuses are also growing more common. Black Box Intelligence’s 2024 data shows companies that partially tie General Manager incentives to retention see 12.7% lower hourly turnover. But retention KPIs require precise tracking across locations and time periods. Manual proration errors don’t just affect payouts — they affect turnover outcomes.
Every mid-cycle change creates another manual calculation that someone has to track, document, and eventually explain when the manager questions their bonus statement.
Reason #4: No Audit Trail
A district manager sends an email: "Adjust Maria's bonus to $1,200 this month—she handled the health inspection during the General Manager’s absence."
Finance updates the spreadsheet. No documentation explaining the override. No record of the original calculation. Just an email buried in someone's inbox.
Six months later, an employee relations inquiry comes through questioning bonus consistency across locations.
- HR needs to reconstruct what happened.
- The email chain is fragmented across three people's inboxes.
- The original spreadsheet has been overwritten four times since then.
- Nobody remembers the exact circumstances that justified the adjustment.
This creates real compliance risk. EEOC filed 950+ pay discrimination charges in FY 2022, and bonuses are specifically included in Equal Pay Act protections. Common litigation triggers include: inconsistent bonus calculation methods across locations and email-based overrides without audit trails.
Version control gets messier when you operate across regions.
- Your Northeast team uses one spreadsheet template.
- Southwest uses a slightly different version with adjusted thresholds.
- Midwest made its own modifications last quarter.
All three regions claim they're following the same bonus policy, but the actual formulas have diverged.
When leadership asks for a company-wide bonus forecast, someone has to reconcile twelve different regional files that all calculate the same role differently.
Reason #5: The Scale Problem
Managing incentive calculations for ten locations in a spreadsheet is tedious but doable. One person can track the KPIs, run the formulas, and answer manager questions without too much chaos.
At fifty locations, cracks start showing.
- The file gets slower.
- Formula errors start happening.
- Regional managers start making their own copies with "small adjustments" that match their market conditions.
Now you have three versions of the same bonus plan running simultaneously.
At one hundred locations, the system breaks completely.
- Regional files don't sync with each other.
- Finance can't see real-time bonus exposure across the company.
- When the CFO asks for Q2 projections, the answer arrives three or four days later after someone manually aggregates data from twelve different spreadsheets.
Leadership needs visibility into cumulative bonus exposure to make informed decisions about hiring, promotions, or operational adjustments. When that data takes days to compile, you're managing the business with information that's already outdated.
Budget forecasts need to be real-time, not retrospective. Without that visibility, finance teams spend their time reconstructing the past instead of planning for what's ahead.
What Actually Works
Restaurant operations are complex, and compensation should reflect that. The solution is removing manual work from complex calculations.
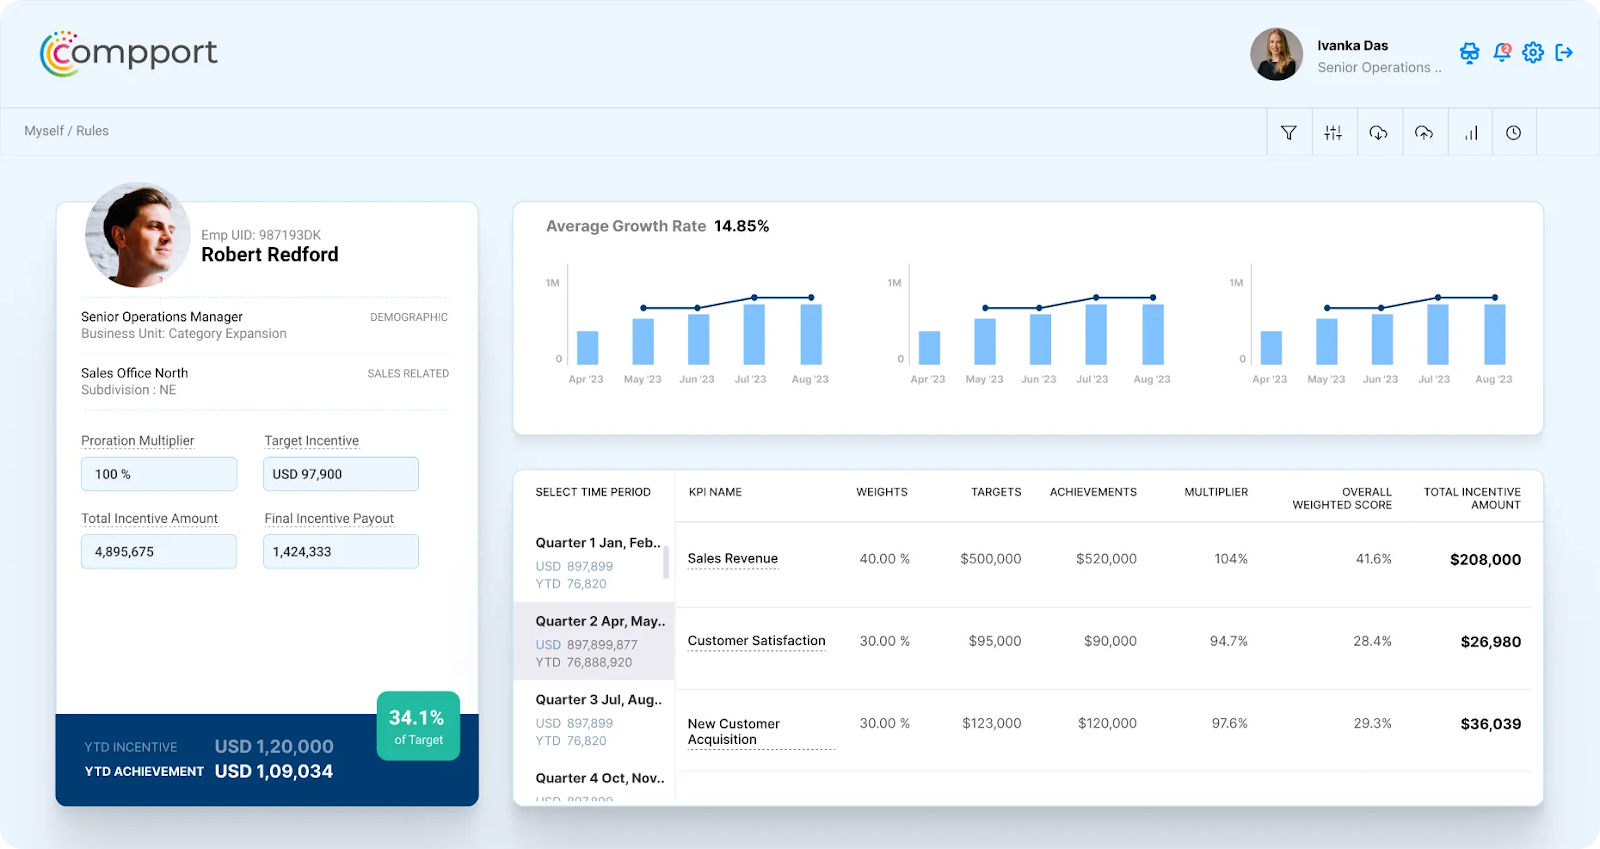
Sales incentive planning platforms like Compport encode exact incentive logic without forcing you to simplify your formulas. Here’s how:
You can build multi-KPI models
Build multi-KPI models with thresholds, caps, weighted metrics, and slope/intercept logic that matches how you actually run your business. QSR bonus plans weigh labor efficiency and throughput. Casual dining plans emphasize guest satisfaction scores. The platform handles both without requiring spreadsheet gymnastics.
Use automated proration for mid-cycle changes
Automated proration manages mid-cycle changes without finance intervention. When an assistant manager covers three locations, the system automatically splits performance metrics. When someone takes leave mid-quarter, it adjusts targets based on actual time worked. No two-hour manual calculations. No three-person verification process.
A unified manager dashboard to show all KPI breakdowns
Manager dashboards show KPI breakdowns in real-time. Instead of seeing a final bonus number with no context, managers see exactly which metrics drove their payout and how they're tracking toward next month's targets. According to Gartner, perception of fair pay experience improves retention by 27%. Transparency turns bonuses from friction points into motivation.
Full audit trails to track all calculations
Full audit trails track every calculation at the employee and location level. When someone questions a bonus six months later, you pull up the complete record—original calculation, any adjustments, who approved them, and why. Email-based overrides get replaced with documented workflows that satisfy compliance requirements.
Real-time visibility
Real-time rollups provide leadership visibility into bonus exposure across all locations, eliminating the need to wait days for manual aggregation. When the CFO asks for Q2 projections, the answer is immediate, not retrospective.
Final Thoughts
Restaurant managers handle high-pressure operations with razor-thin margins. They shouldn't also handle spreadsheet chaos every incentive cycle.
When calculations take 30 minutes per manager, when mid-cycle changes eat two hours of finance time, when leadership waits days for basic forecasts—you're not running an incentive program. You're creating an administrative burden that costs real money. Replacing one manager runs $15,000-$20,000.
According to 2024 Black Box Intelligence data, replacing a single General Manager costs $16,770 in separation, replacement, and training costs. Non-GM managers cost over $10,500 to replace. When incentive calculations create distrust, the financial exposure isn’t theoretical — it’s measurable.
Sales incentive platforms like Compport eliminate the manual work.
- Automated calculations
- Real-time dashboards
- Proper audit trails
- Instant rollups for leadership
Your bonus logic stays as complex as it needs to be. The spreadsheet nightmare disappears.
Stop dreading incentive cycles. Automate them.

FAQs
How do restaurants handle bonus calculations when managers transfer between locations mid-cycle?
Most use manual proration in spreadsheets, splitting time periods and applying different performance metrics for each location. This takes 2+ hours per case and requires multiple people to verify accuracy.
What KPIs do Quick Service Restaurants prioritize differently from casual dining?
QSRs weigh labor efficiency and throughput heavily, with tighter cost targets around 30-32% of sales. Casual dining emphasizes guest satisfaction, NPS, and repeat visits more, with labor targets closer to 36-40%.
Why does the lack of bonus transparency cause manager frustration?
When managers only see a final number without KPI breakdowns or threshold explanations, they can't understand what drove their payout or how to improve performance next cycle.
%20(34).avif)
%20(50).png)
%20(49).png)